Water Content Map from Satellite Data
During summer every year, we often hear such questions as “Will drought happen this year?” or “How high will the temperature rise?” The satellite data can answer these questions.

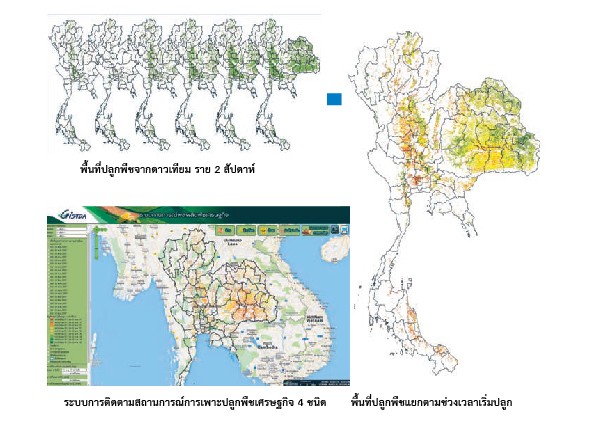
The Normalized Difference Water Index (NDWI) Map of April 2013, analyzed from MODIS Satellite.
Can satellite data tell something about drought?
The satellite data is only a type of information that supports and indicates how severe drought is likely to happen in a certain area, presented in the form of water content map. The data is processed by analyzing drought indices together with field surveys to collect information on volumetric soil water content (percentage) by using W.E.T. Sensor Kit.
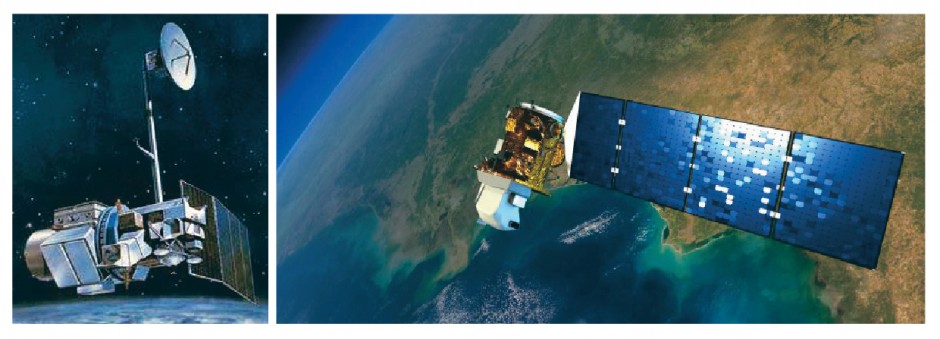
The satellite data that is used for analyzing and monitoring the situations concerning natural resources and disasters mostly comes from optical satellites, which function like a camera. Each satellite provides different data. The used data is derived from Terra and Aqua Satellites with MODIS instrument on board. How good is this data?
The advantages of Terra and Aqua MODIS satellite data
• The orbiting satellites take pictures of Thailand at least four times a day, as there are two satellites in the system—Terra and Aqua—that can re-orbit over the same area twice a day. Therefore, any changes that occur from varying situations can be monitored immediately and almost in real time.
• One image taken will cover a wide area of entire Thailand and its neighboring countries. With a swath width of 2,300 km, the satellites are able to provide an overview of the area and the ongoing situations.
• The data can be recorded in 36 wavelengths (between 0.4 – 1.4 micrometers) with image resolution ranging from 250 to 1,000 meters. Therefore, the MODIS system can be beneficial for land marine environment.
What are drought indices?
Drought indices are indicators relating to factors that contribute to low water content in different environments which result in water shortage.
The indicators were developed through the studies of previous drought indices and grouping of indices that share similar attributes.
One of the important drought indices is the one using remote sensing data.
The index from satellite data that is apparently related to water content or moisture level of the crops is known as Normalized Difference Water Index (NDWI)
NDWI is an index used to examine water content of soil or crops by measuring the amount of solar radiation reflected from the soil or crops in the near-infrared (NIR) and short-wave infrared (SWIR) wavelengths. If the soil or crop water content is high, the SWIR radiation will be more absorbed and less reflected, resulting in an increase of NDWI index.
After receiving index data from the satellite, how to know whether that area is prone to drought?
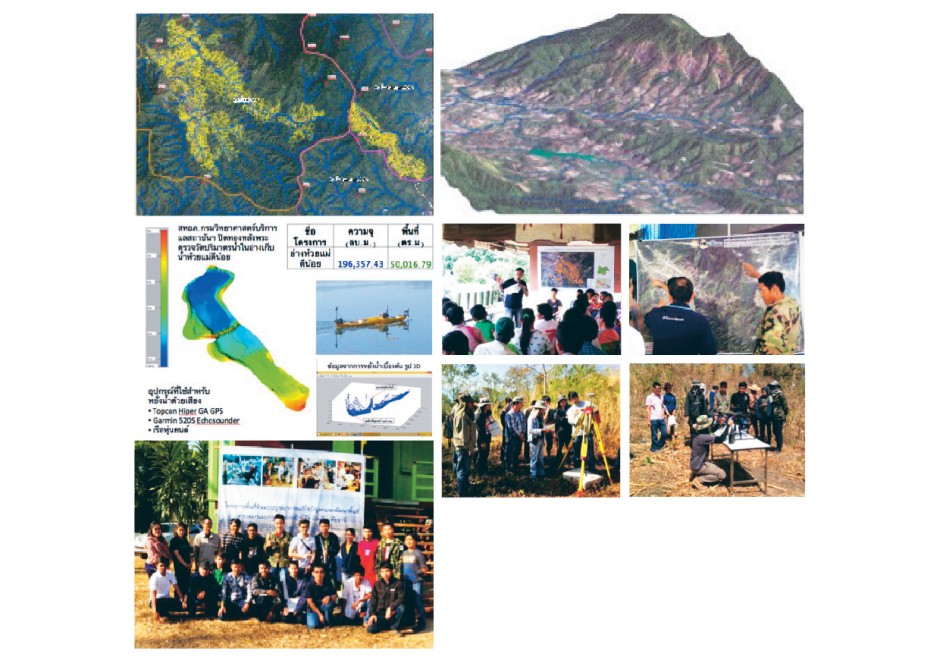
The drought prone areas as indicated by the satellite data is only physical data of the soil or crop water content collected from field surveys in Nakhon Ratchasima and Nakhon Sawan provinces, by using a scientific instrument called W.E.T. Sensor Kit.
What is W.E.T. Sensor Kit and how is it used?
W.E.T. Sensor Kit is an instrument used to collect data of volumetric soil water content (percentage), measured directly from the soil at 0 – 10 centimeters deep, 6 - 8 spots in each plot. About 60 plots of land are randomly selected in the two provinces. Most of them are cultivation areas for economic crops including rice, sugarcane and tapioca. The sample plots are agricultural land that is already harvested or in preparation for the next growing season. The survey teams had fielded the sample plots to collect data during March – May, which is the country’s most dry period.
Once receiving the soil water content data, what is it used for?
GISTDA has a set of water content indices from satellite images and percentage of soil water content collected from field surveys. Both groups of data are found related to each other, that is, if the water content index from satellite images is high, the soil water content is high, too. Therefore, if the water content index from satellite images is known, we can estimate the soil water content, and then partition the percentage of soil water content in accordance with the criteria of Skye Instruments Ltd. (1999). Then a water content map will be created from the satellite data, with classification of high, medium, and low water-content areas.
These groups of spatial data is useful for public agencies and the farmers. The current land use data can be superimposed over the land’s NDWI data, in order to examine whether the land to be cultivated is in the area of low water content. If so, cultivation should be avoided over that period, or if it is strongly needed, there should be selection of crops that require less water or are drought tolerant. In addition, water resources should be provided to ensure enough water throughout the growing season. For the cultivated land, cooperation should be sought from the concerned public agencies and officials to provide sufficient water resources for agriculture and consumption.